Efficiency, speed, and cost-optimization are the fundamental hiring principles. That’s why handling recruitment analytics is paramount. Regardless of whether you need to measure the effectiveness of your internal hiring processes or you want to prove your worth to your clients.
The reality is that most stakeholders know that they should measure and analyze recruitment data, but the majority still need guidance on how to start.
In this article, we will dive into the importance of recruiting metrics, highlight the latest stats for recruitment ops, and — most importantly — guide you through recruitment analytics software.
Ultimately, you will know how to recognize your process bottlenecks and optimize your efforts and budgeting.
Let’s go!
What is recruitment analytics?
Recruitment analytics involves investigating recruitment metrics and data-driven insights and using software tools to refine hiring processes. It’s a set of activities of analyzing recruitment data and hiring KPIs such as time-to-hire, cost-per-hire, sourcing channel effectiveness, or quality of hire.
With the help of historical data and recent numbers, recruitment managers, CEOs, and HR directors can identify bottlenecks, find more qualified applicants faster, and optimize hiring costs.
Why is recruiting analytics essential for your business
With today’s technological and economic seismic shifts, the business landscape is changing fast. As in, with supersonic speed.
And this also applies to the job market — layoffs, new job roles, employee turnover, and recalibrating the way departments and companies operate. There’s no doubt that the recruitment industry must keep up the pace and face several challenges.
Let’s break them down:
Challenge #1: What are the recruitment costs
Unfortunately, many recruiting teams across the board still try to figure out the cost of a hiring process.
How much do companies have to invest in finding and hiring qualified candidates? Is the cost-per-hire $3000 as it used to be in 2020, or is it more likely to hit $5000, the upper limit of the 2023 benchmark?
Without analyzing data, you won’t be able to know the cost of filling an open position.
Challenge #2: Where are the bottlenecks
Time-to-hire is one of the key metrics that hiring teams use as a barometer of the effectiveness of their recruitment processes.
According to TRAFFIT’s recent study, in most cases, the average time-to-hire has increased:
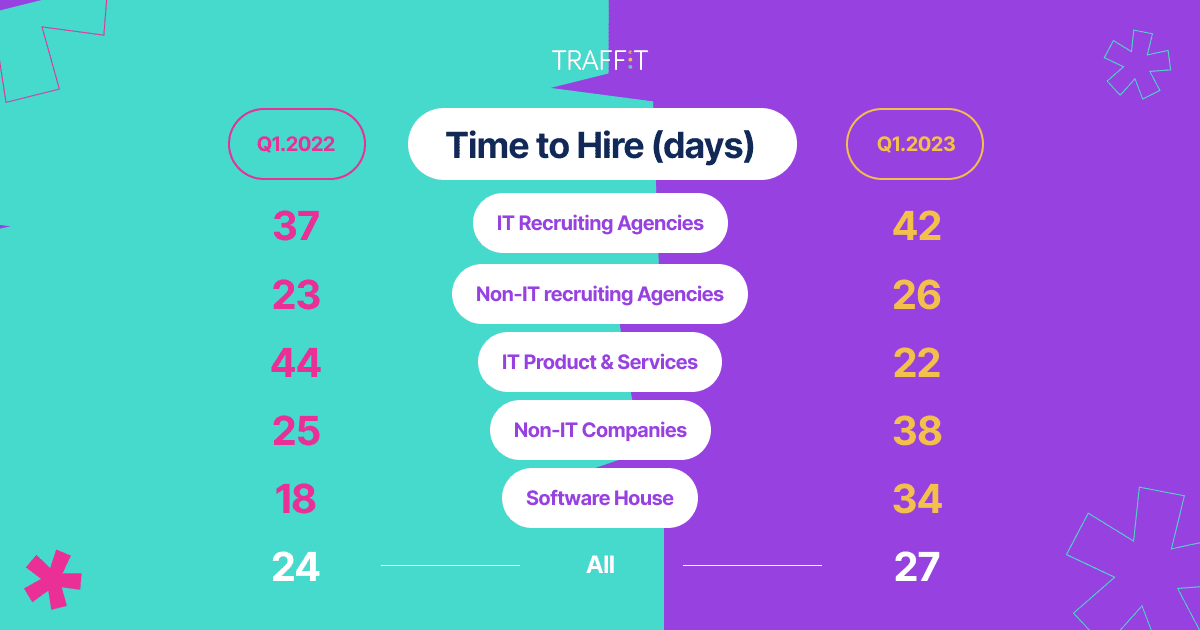
You can discover where the hiring process gets stuck by going deeper into your statistical analysis. Knowing those bottlenecks and diagnosing why particular stages consume more time than others will help you find solutions.
Challenge #3: How to improve hiring processes
Without analyzing recruitment data, there’s no room for streamlining and optimizing your talent acquisition program. In turn, discovering patterns and trends regarding your candidate sourcing will help you to revamp your tactics.
For example, your stats can prove that, over time, LinkedIn was the most successful applicant source. Once you know that, you can justify increasing your budget in that channel.
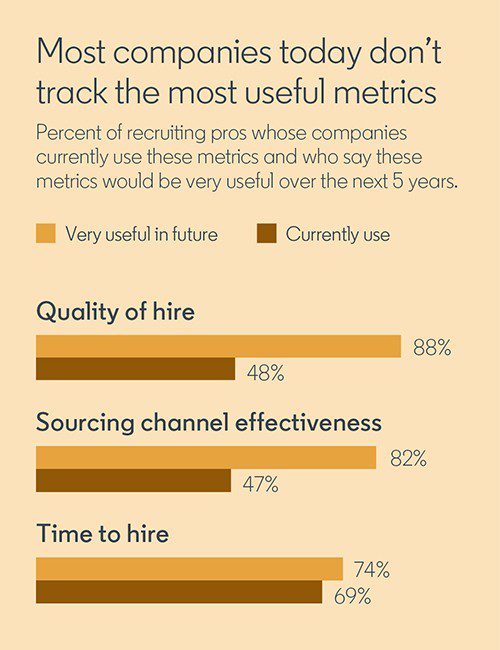
Speaking of LinkedIn, this platform’s research indicates that sourcing channel effectiveness (right next to the quality of hire) is about to become of the most valued recruitment metrics:
Challenge #4: No tools to collect data
The last most common pitfall for recruiting managers is the lack of relevant technology. With no comprehensive software, neither predictive analytics nor operational reporting will be achievable. And — let’s say it out loud: manual work in spreadsheets is NOT even a baseline for efficient recruitment analytics.
An ideal scenario is where you have access to an applicant tracking system with a reliable and advanced reporting dashboard that will help you to track and analyze:
- Time-to-hire, time-to-offer, and time-to-reject
- Top application source
- All the data about your current hiring pipeline
- Effectiveness of your talent pool
- Job boards performance
- and quality of hire.
Top reasons to start recruiting analytics
“Data is the new oil” is an overused statement but extremely valid for talent acquisition. If you want to:
- drum up the results of your recruiting team
- make data-driven hiring decisions
- hire the most qualified candidates more efficiently
- optimize your job advertisements
- identify trends and find solutions
- increase your time to fill
Then, searching for applicant tracking systems with comprehensive recruiting data should be your next move!
Introducing new recruitment analytics from TRAFFIT
$60K is how much one of our clients saved after we walked them through their operational reporting and relevant data. Our recruiting analytics helped them to discover which application sources bring results and which are bad performers.
Diving into those key metrics, we’ve found that some companies were unnecessarily paying for 20,000 candidates already in their talent pool!
Those valuable insights inspired us to collaborate with our clients and develop a revamped version of our recruitment analytics toolkit.
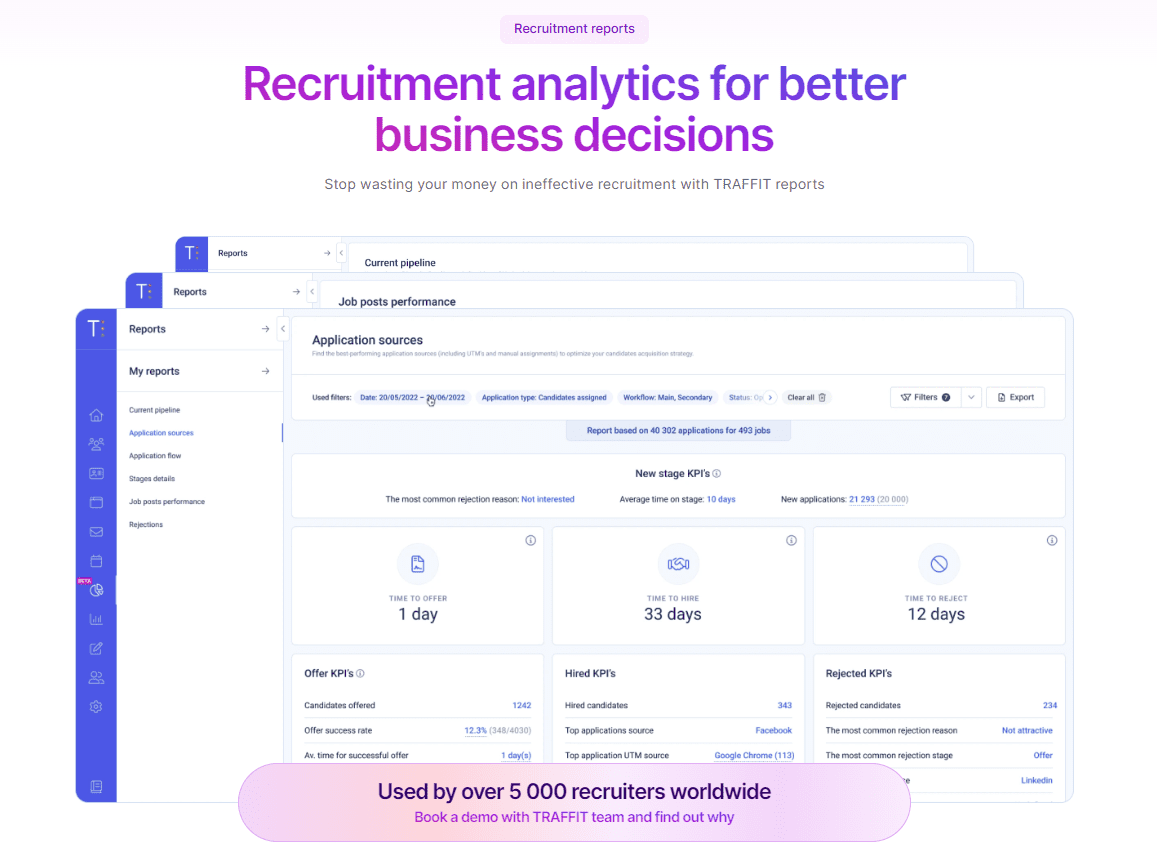
Here it is — TRAFFIT advanced reporting!
Analyze your hiring process in a snap
What comes to your mind the first second you hear “analytics”? We’ll go first. A time-consuming process gated by a busy data-science engineer, which results in a report that is hard to understand. And on top of that, explaining it to your boss or your agency clients.
That’s the old-school way. And it’s time to leave it where it belongs — in the past.
With TRAFFIT, you don’t have to wait in the queue for your analytics department and measure your hiring efforts across numerous data sources. Instead, you have 24/7 access to recruiting analytics and a clear overview of thousands of data points in seconds.
Optimize your recruitment funnel with analytical tools
Each successful hiring team has one ultimate objective — finding and hiring the best candidates without wasting too much time, budget, and resources.
And that’s why recruitment analytics plays a significant role here. Now, we will guide you through all the features in our brand-new analytical toolset!
Time to hire, time to offer, and time to reject
If you work in an IT recruiting agency, your benchmark for time-to-hire is 42 days. It gets quicker to land new hires for non-IT agencies (26 days), for IT companies (22 days), or non-IT brands (38 days).
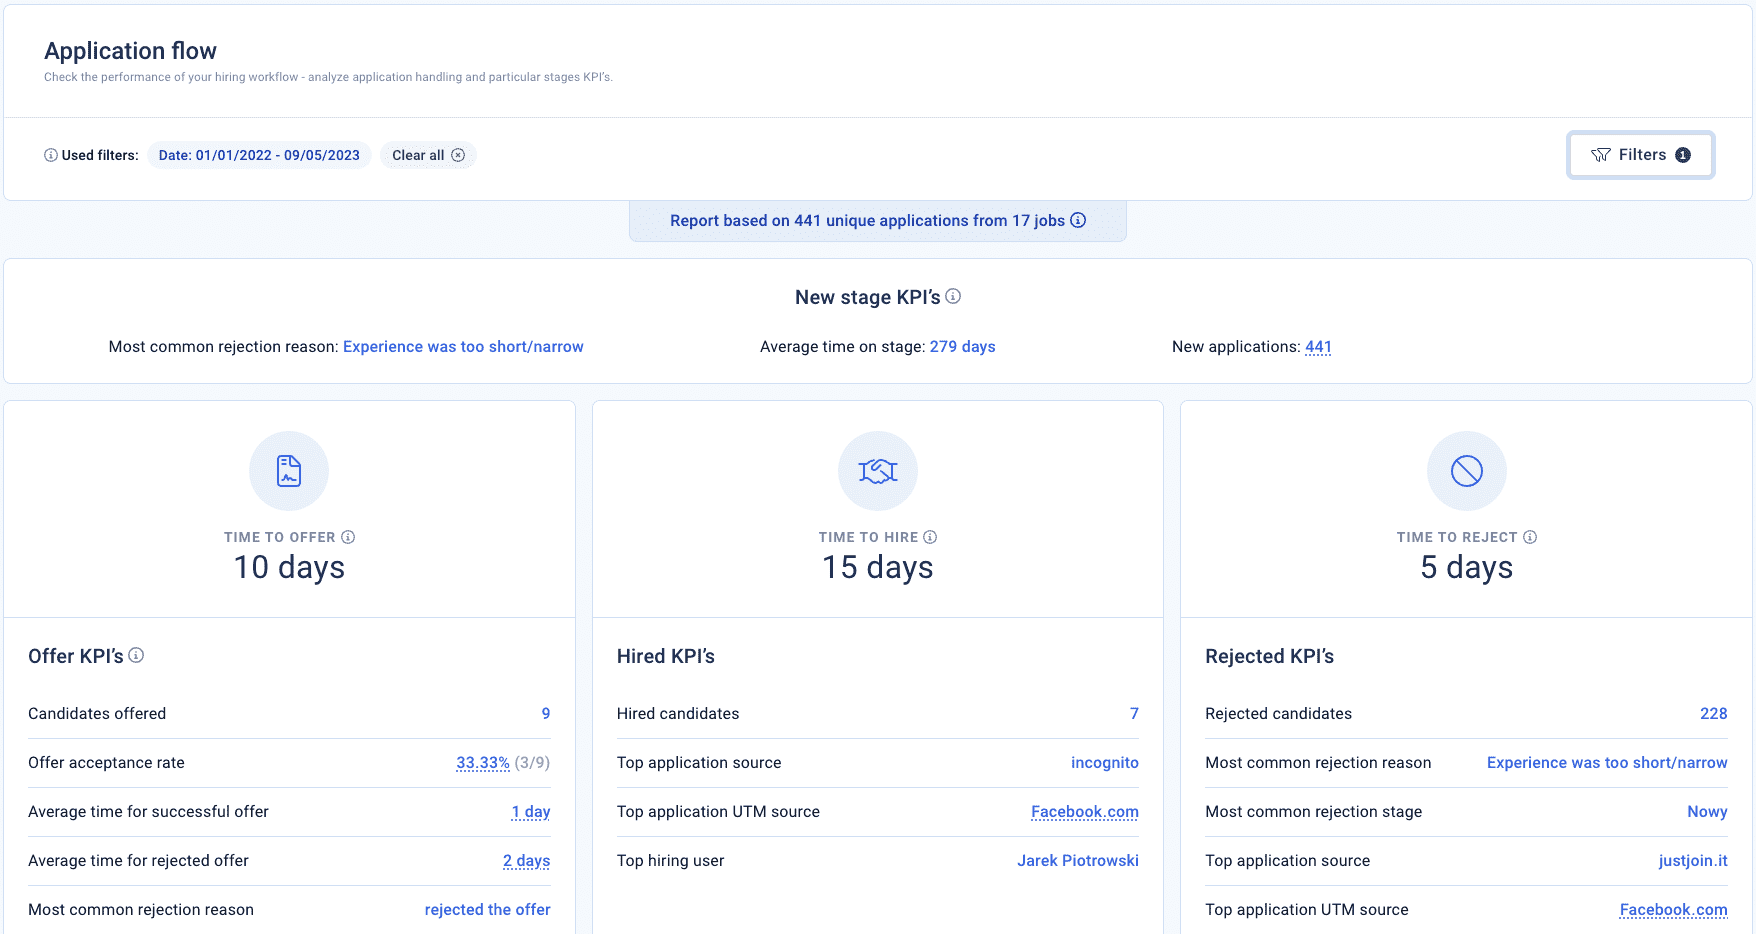
But how to find out if your hiring team is above or below the average? Go to your TRAFFIT account, and select the “Application flow” option in your recruitment analytics dashboard.
As you can see, three fundamental KPIs are right there in front of you, showing how many days it takes regarding:
- Time to offer
- Time to hire
- Time to reject
- and how many applicants received an offer or got hired.
Offer acceptance rate
Yes, optimizing time is one of the most crucial goals for building a company’s workforce. But there’s another metric around the corner you cannot oversee.
Here’s how the story goes: you managed to source several true talents. The interview process goes smoothly, the feedback from your hiring manager is excellent, and the assessment shows that you have your best candidates.
So, what happens next? You send the offer, but only in some cases applicants accept it.
With TRAFFIT, you know how many candidates take the job. In other words, you can easily measure your offer acceptance rate.
Top application source
According to our 2023 benchmark report, talent pools are the leader when it comes to the top application source:
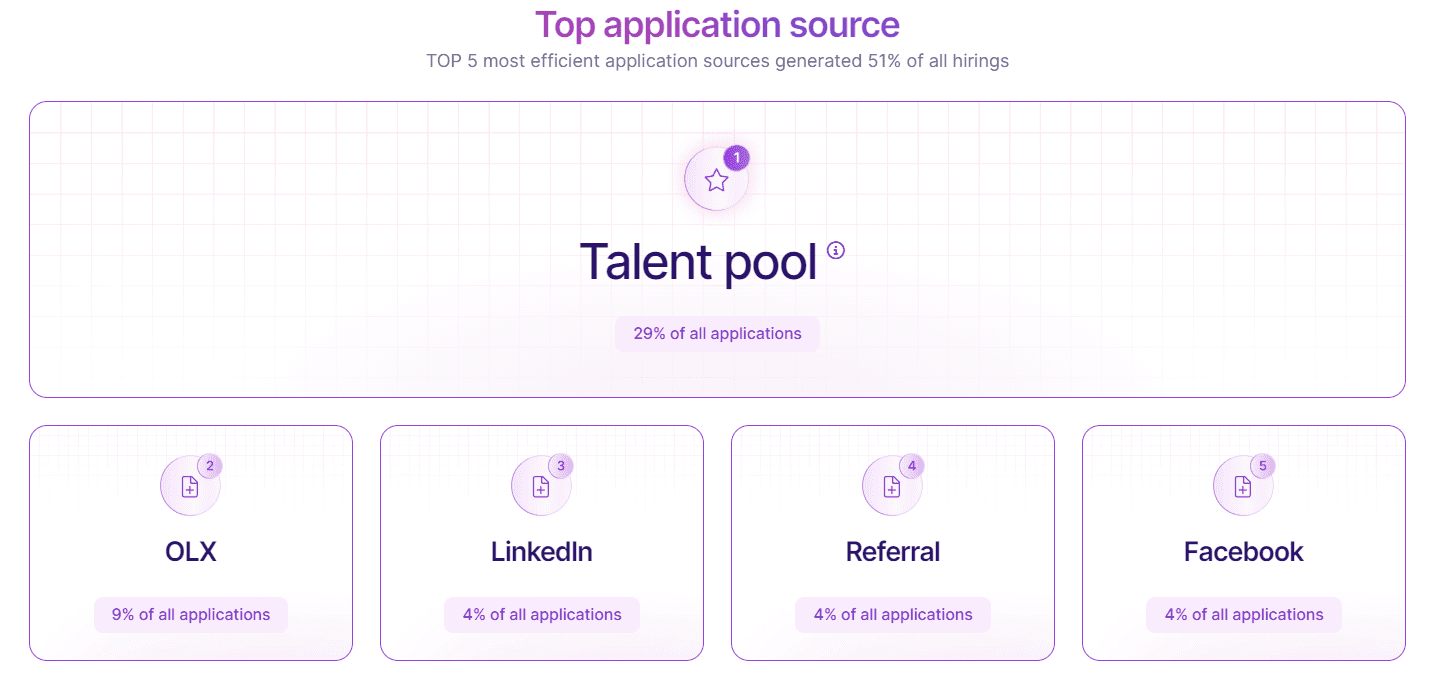
However, in terms of your hiring process, the situation can be different. It can turn out that LinkedIn generates the most applications, followed by your referral program.
The application source efficiency is the cornerstone of our recruiting analytics. But we encourage not to simplify it to an equation: the number of applications from a particular source = the number of new hires.
It’s much more complex. With our recruiting software tools, you can measure:
- how many applications came from a source
- how many new hires came from a source
- the correlation between the number of offers and a source
- the correlation between a source and a rejection reason
- the most popular application source
- and the best-performing application source — the most professional approach would be if you add UTMs to your job publications. If you do that, they will be analyzed as well.
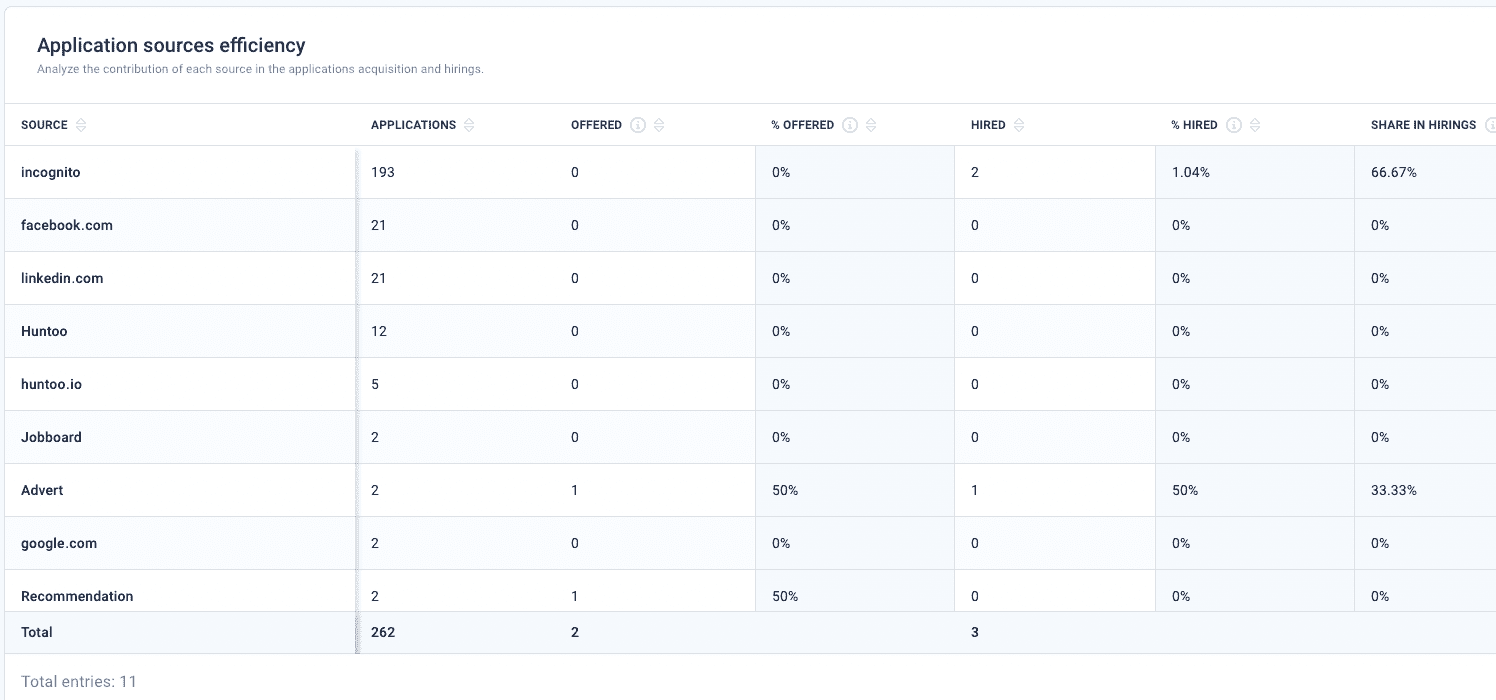
And apart from the in-depth character of our data, our reporting is super easy to digest and fun to present to other stakeholders. No more analytical drama!
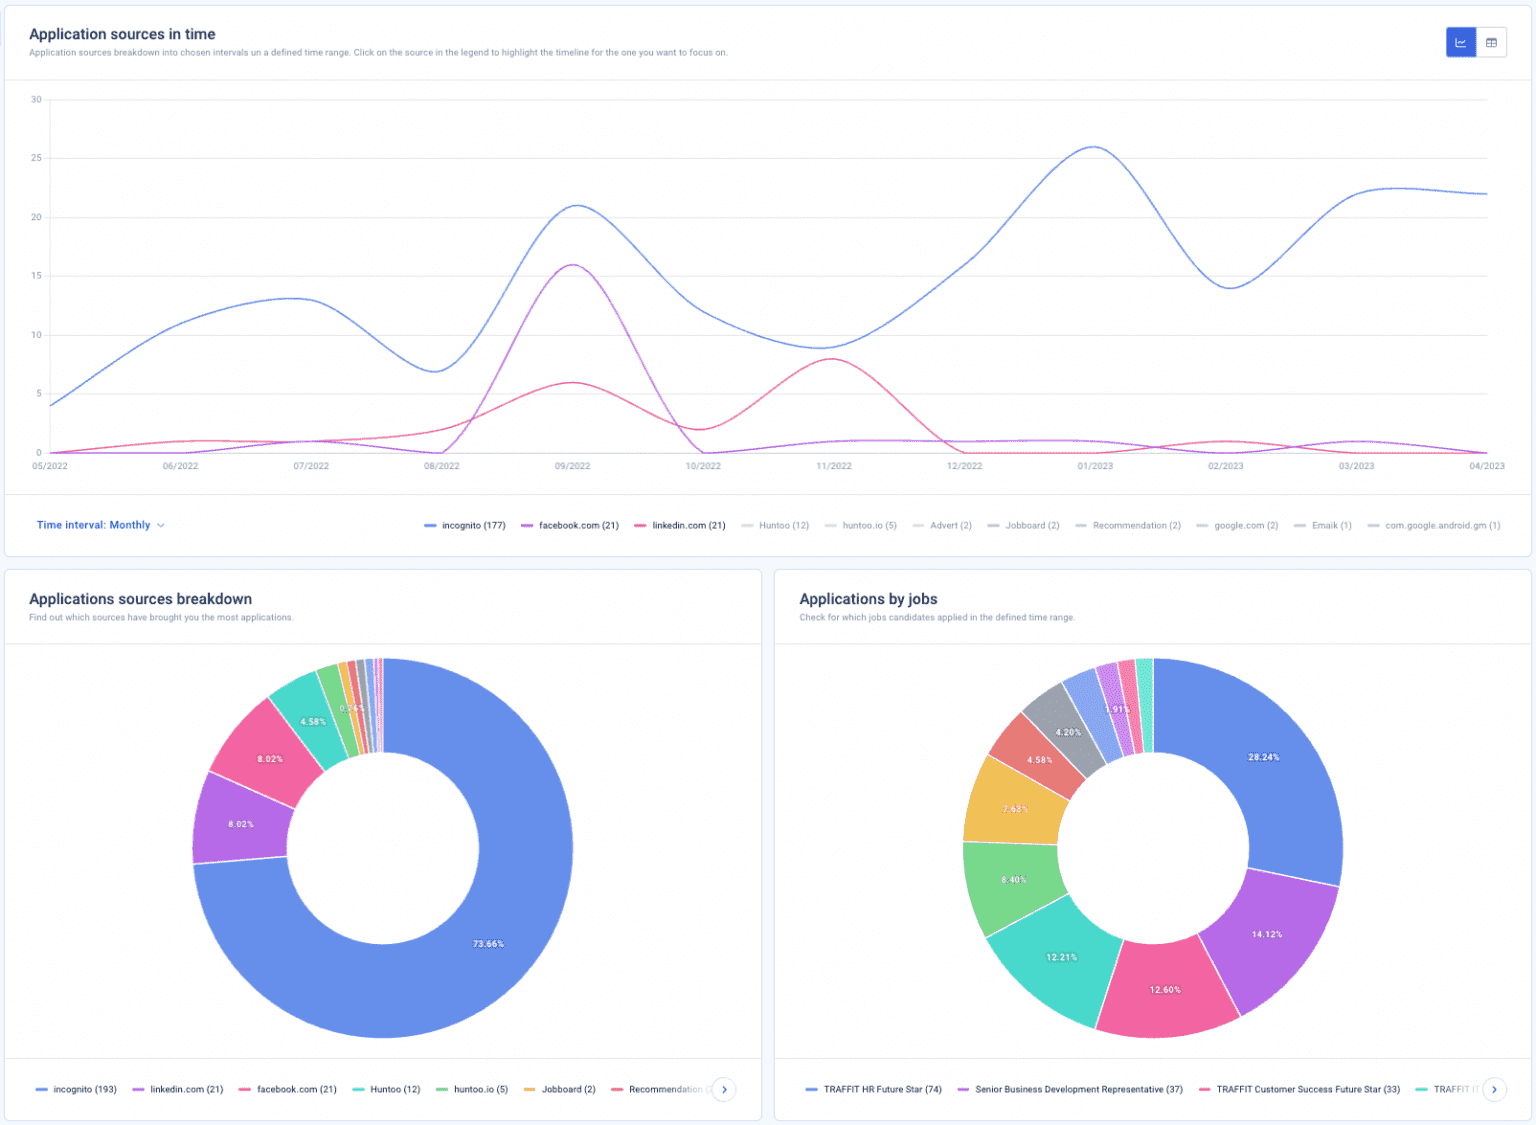
Job posts performance
As a recruiting manager, you spread the word about your job openings on social media and various job boards. The ancient way of measuring the results of job advertisement activities was drowning in spreadsheets and jumping from one browser tab to another.
Luckily, the new opening for optimizing job ads is a few clicks away! With our recruitment analytics, you can see how many applications came from which job ads and what candidate conversions look like in each channel.
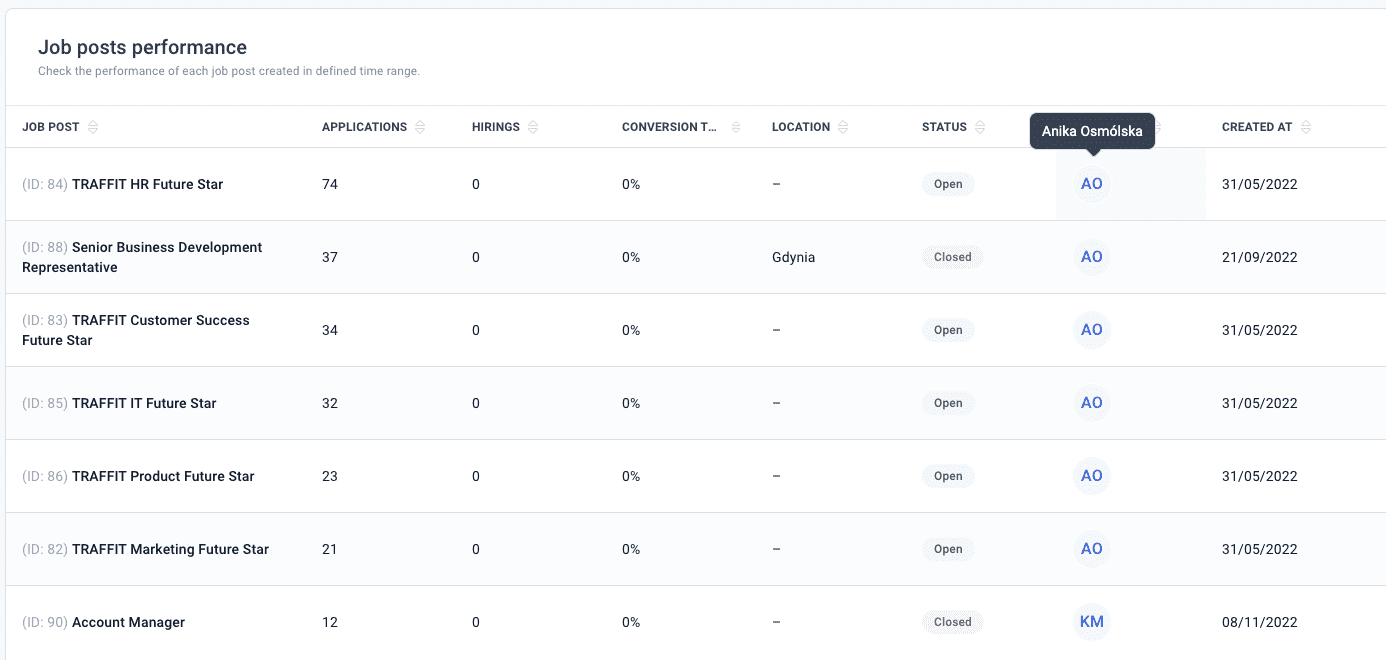
But hold on! The best is about to come! Instead of wondering which job description will make job seekers gravitate to your opening, you A/B test it! Yes, A/B testing is a good practice in email marketing and other digital campaigns, so why not implement it in your following recruiting process?
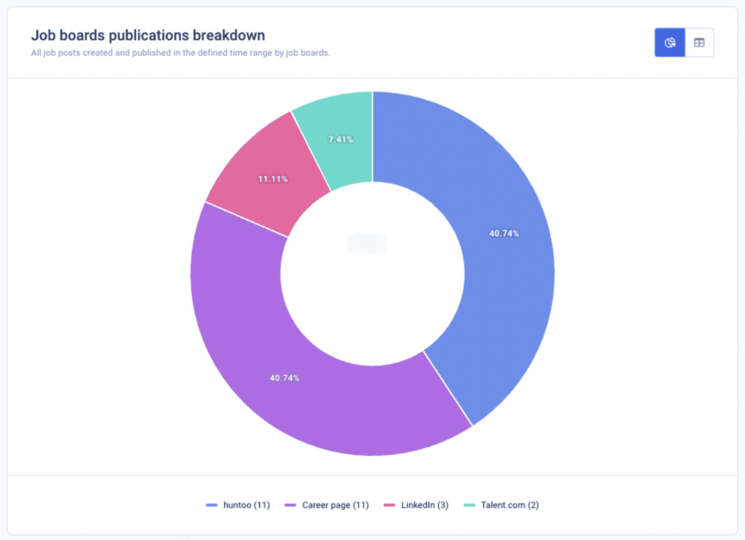
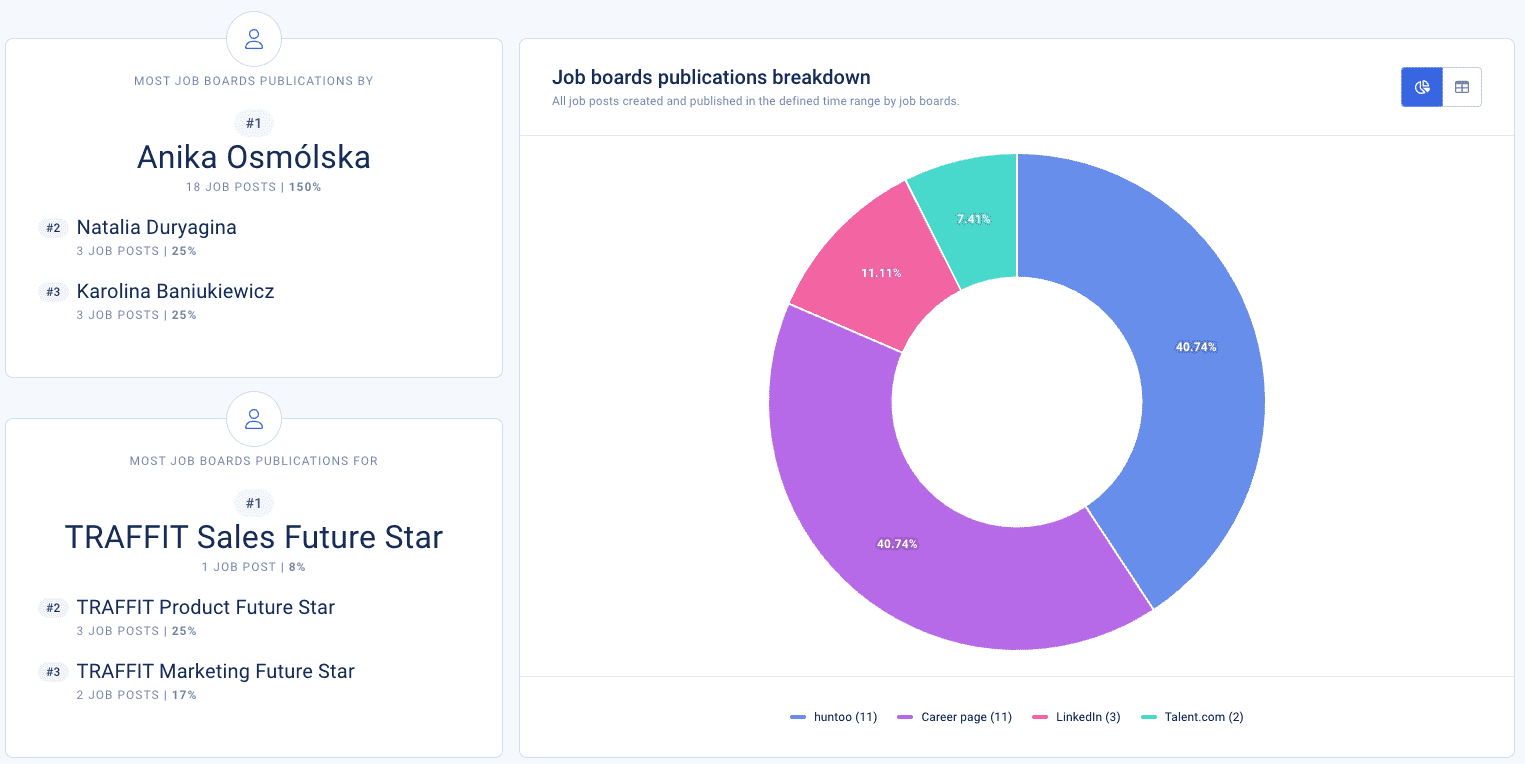
As a cherry on top, with TRAFFIT’s recruiting analytics, you get an overview of your job boards publication breakdown:
Rejections reasons breakdown
Most candidates will not qualify for further stages of your hiring process, and that’s OK. What’s not OK, though, is losing sight of why they didn’t meet the requirements and make it to the next stage of your recruitment funnel.
Again, manual notes in Excel are a no-go. Instead, have it all under your fingertips! With a detailed pie chart, you can see the percentage of rejection reasons.
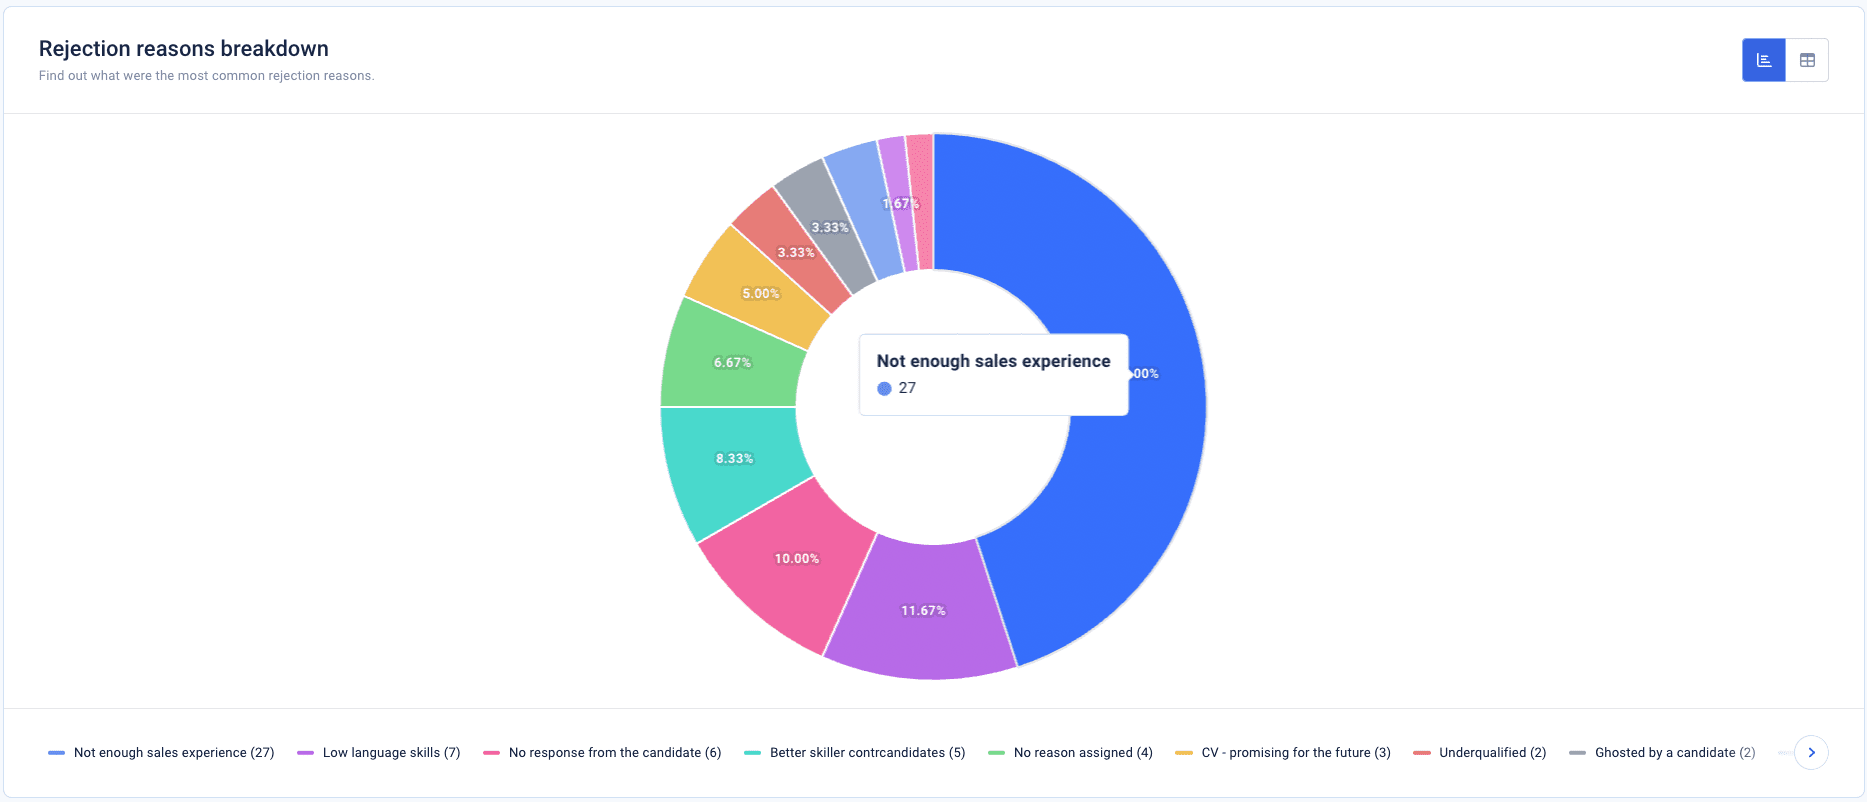
The most common ones you can experience in your hiring process are the following:
- Not enough experience
- Poor language / communication skills
- Candidates with more competitive skill sets
- No response from candidates
An interesting metric you can find useful for your future recruitment process and informed hiring decisions is “promising for the future”. If you have a similar position to fill, you can reach out to those job seekers right off the bat.
It’s worth highlighting that we are not only providing quantitative reasons. We went further, connecting the dots between the reasons and stages of your application process. This in-depth analysis is scarce among application tracking solutions!
And much more!
There is always room to optimize your recruitment process. And with a proper analytical toolset, you can make it an ongoing program.
Besides the above reporting capabilities, our web app brings much more to the HR table:
- It helps you to stay on top of your talent pipeline. With filtering options, you can gather actionable insights and compare results from different angles.
- See how top metrics change over time. Are there any upward or downward trends you need to know? Predictive analytics in recruitment is a must to stay competitive.
- Where are those bottlenecks? With TRAFFIT’s recruitment analytics, you can discover how much time your team spends on each stage of the hiring process. If there are any redundant activities or things your team can automate, you will significantly improve your time to fill.
- Data EVERYONE will understand. We can’t emphasize this part enough. Recruiting analytics reporting must be easy to digest for all stakeholders, including non-technical managers or clients.
Maximize your ROI with recruitment analytics
Remember that we mentioned our client that saved $60K thanks to solving inefficiencies highlighted in our reporting module? The annual cost of using TRAFFIT recruiting software is $790 per user. Even if you have a team of ten recruiters, that would cost $7,9K annually. Considering the 60 thousand saved, even with a year’s software license investment, you will be ahead by more than 52 thousand.
Those numbers are examples, of course, but you see where we’re getting at. By implementing data-driven recruitment strategies and processes, your company can recalibrate how you handle each hiring process, improve candidate experience, and ultimately achieve a higher ROI on your recruitment investments.
With data assembled by your recruitment analytics software, you can come up with informed decisions about where to allocate your budget and resources:
- Assess how many hours your team spends on each stage and the cost of that work.
- Calculate the cost of all your ads spend, and check which channels deliver results and which ones you can get rid of.
- For example, some recruitment activities can turn out as throwing away your money. As we said, one of our clients found that they’ve been double paying for as many as 20,000 candidates! Any waste of time and money of that kind is preventable with our predicting analytics software!
Time for your data-driven talent pipeline
According to LinkedIn, 68% or talent acquisition pros declare that they need better recruitment tools and technology to boost their performance by the end of 2025. We bet that you want to be in that winning camp as well!
There’s no doubt that recruitment analytics plays a key role in discovering which recruitment activities work, and which do not.
By choosing TRAFFIT’s reporting solution, you will:
- optimize your next hiring process, saving your company hours of work and thousands of dollars
- reduce time to fill
- improve your candidate experience
- and maximize your ROI.
Last but not least, to make the most of its features, you don’t have to be a data science engineer!
Take TRAFFIT for a 14-day free test drive (no strings attached!) or book a demo call with us — we will show you how to use our recruitment analytics in detail!
